1. New "Boards Flow Metrics" widget
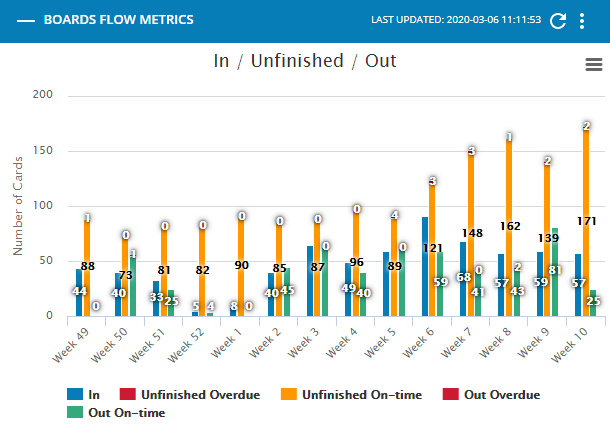
The new "Boards Flow Metrics" widget provides a high-level overview of throughput on а single or multiple Kanban boards. The widget displays In/Unfinished/Out metrics for cards and initiatives per selected period of time. By default, the widget is set to group the data by weeks.
The diagram bars visualize the number of work items that have been created or moved to the "Requested" or "In Progress" column (In) and the number of work items that have been completed (moved to "Done" or "Archive"). By default, the widget displays how many of the completed work items have met their deadline (Out on-time) and how many did not make it before the deadline (Out Overdue). Users can also see when some of the items that are still in progress "Unfinished" are:
- beyond the specified Deadline (Unfinished Overdue)
- within the specified Deadline (Unfinished on-time)
The widget allows further configuration of the following time-related properties:
- Cycle time is less than "X " days. Set it up in accordance with your use case. This setting is very useful for service-level agreement monitoring and determines whether time targets for resolution are met.
- Planned end - set it up if you apply the Timeline workflow to your process and need Timeline Initiatives monitoring. The Timeline Initiatives are considered On-time if their Planned end date has been met.
Check the dedicated article to learn more about the widget configuration options.
2. Cards stagnation metric in the HeatMap
As part of our continuous effort to improve the analytics in Kanbanize, we introduce the ability to track the “stagnation” of the cards in the workflow. To address this necessity, we enhanced the Heat Map chart by introducing two new measures: Stagnation and Stagnation (weighted). 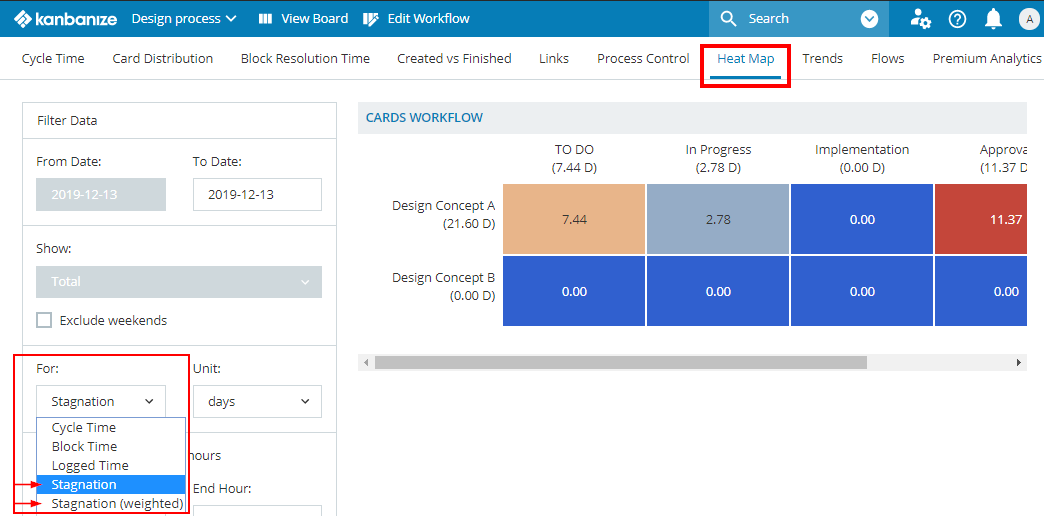
-
The “Stagnation” metric defines how much time (total/average) a card remains in a specific cell.
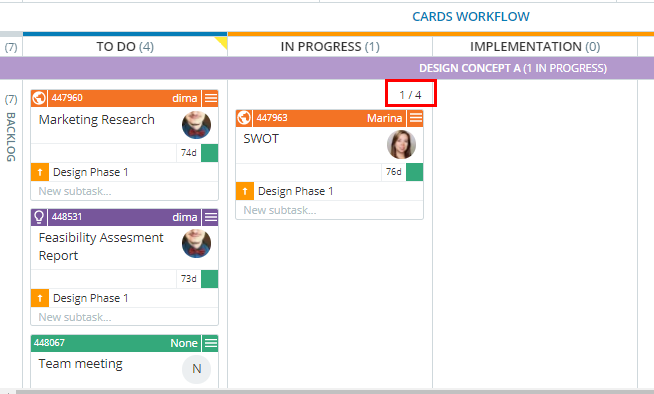
A cell is an intersection between a column and lane. The image below visualizes a cell. Measurement of stagnation time starts in a moment a card enters a cell.
This metric acts as an indicator when a card remains stuck for too long at a certain stage of your process flow. It also provides a good estimate for the average time you need to complete the tasks at a certain stage.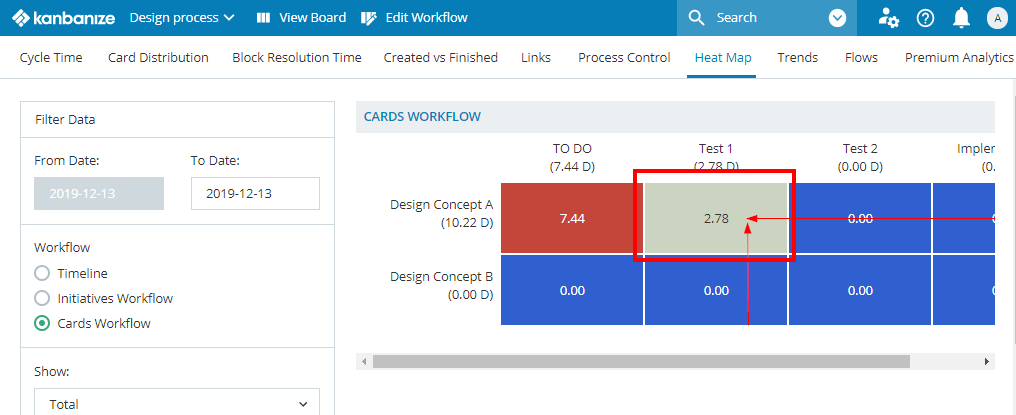
- The “Stagnation (weighted)” metric shows the average time cards spent in a certain cell (for a chosen period), multiplied by the number of cards that were there at the end of the period.
For example: if the average stagnation time for the stage is 1 day and currently there are 10 cards within it, then the “Stagnation (weighted)” time will be 10 days.
For proper assessment of this metric, we recommend you to select a time range not shorter than a 3 month period. This will produce more accurate average results.
“Stagnation (weighted)” metric provides a valuable estimation of how much time is needed to complete a certain number of cards in a given cell from your process.
Learn more about the Heat map configuration and its capabilities in the dedicated article.
3. UX Product Improvements
Our team is committed to ensuring that every user has a great experience using Kanbanize. We constantly dedicate efforts to improve our product design and its usability.
In Kanbanize 6.22, we have redesigned certain UI elements. We have updated the appearance of our cards and Initiatives adding rounded corners to the items visualization. Borders are added to better distinguish columns, lanes and Timeline tracks. 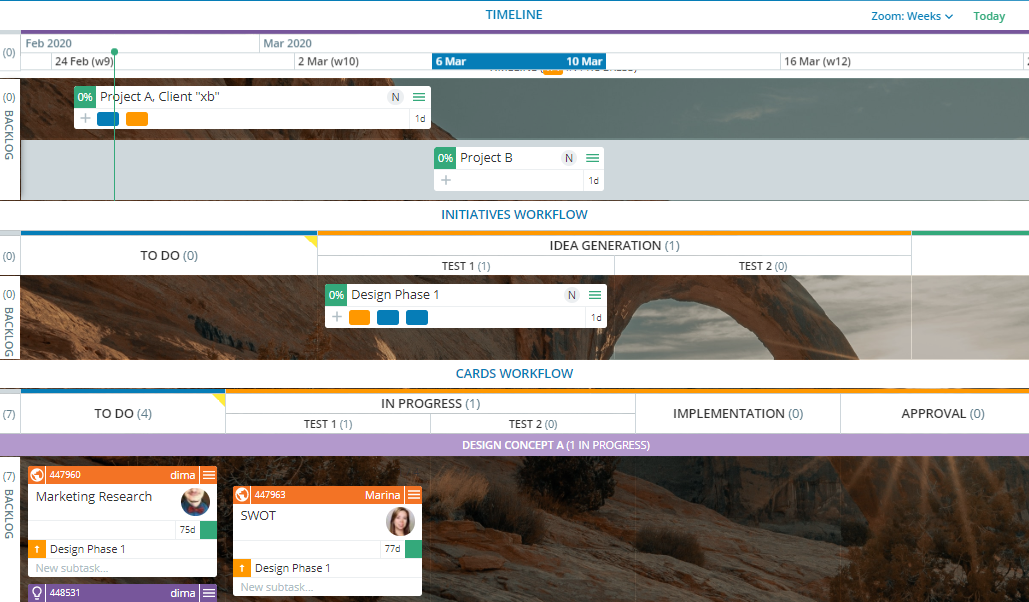
4. Other Product Improvements
Here is the list of other product updates that meant tо improve your experience with Kanbanize:
-
Updated UI languages
All interface languages in Kanbanize: Deutsch, Spanish, Portuguese and French have been updated to the latest product version. To learn how to switch your UI language, please check the dedicated article. - Better visibility of cell WIP limits
Putting a WIP Limit on specific cells in the workflow fits in many use-cases.
When applied, the cell WIP limit becomes visible at the top of the cell, making it more apparent.