Welcome to Kanbanize 7.0. Let's dive into these powerful new features and improvements!
1. The Analytics in Kanbanize just got 10x better
With Product Release 7.0, all Kanbanize users that have added Analytics in their subscription plan will be able to use our new and way more advanced analytics charts and forecasting models.
The old analytics charts are deprecated, but still can be accessed under the "Deprecated Analytics" tab.
The new Analytics screen presents 5 categories: Cycle Time, Throughput, WIP, Flow, Forecasting, each available as a tab item on the page. Click on a tab button to view the charts for each of the respective metrics. The greatest upgrade of this feature is the option to display combined Analytics for multiple Workflows on a certain board.
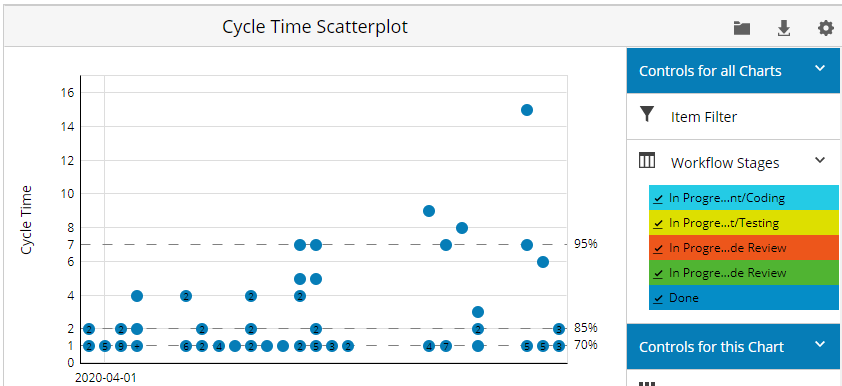
The new version supports flexible filtering, which allows focusing on a smaller portion of data for in-depth analysis.

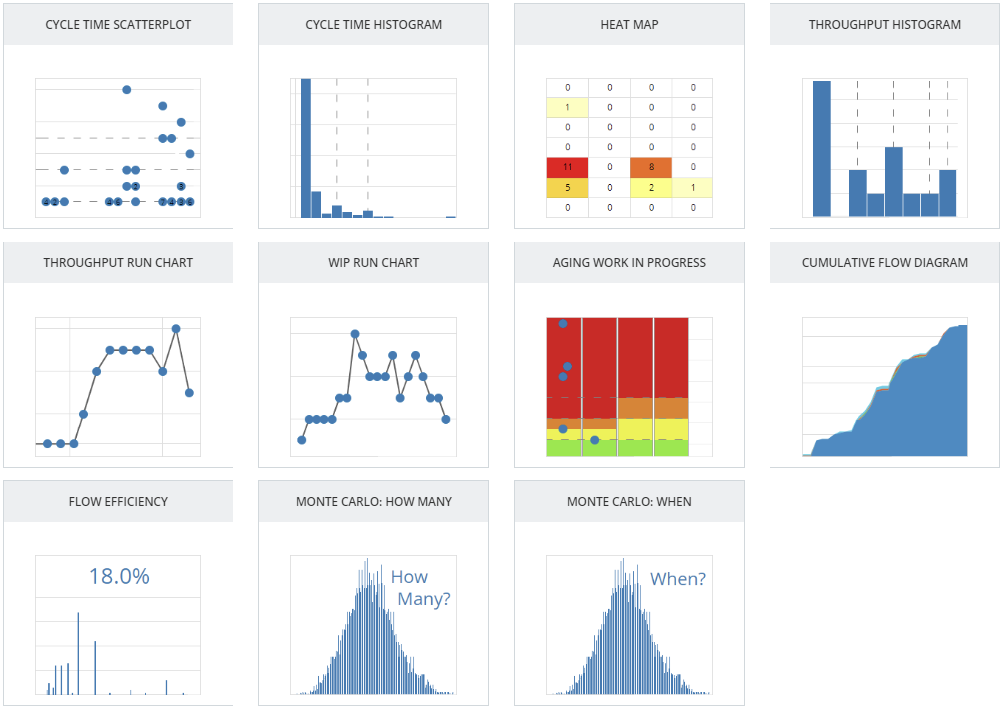
Here is the distribution of charts in the 5 categories:
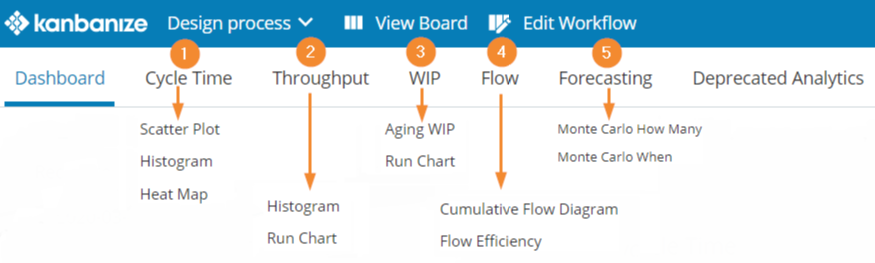
(1) Analyze Cycle time using the Scatter Plot diagram, Histogram, or Heat Map.
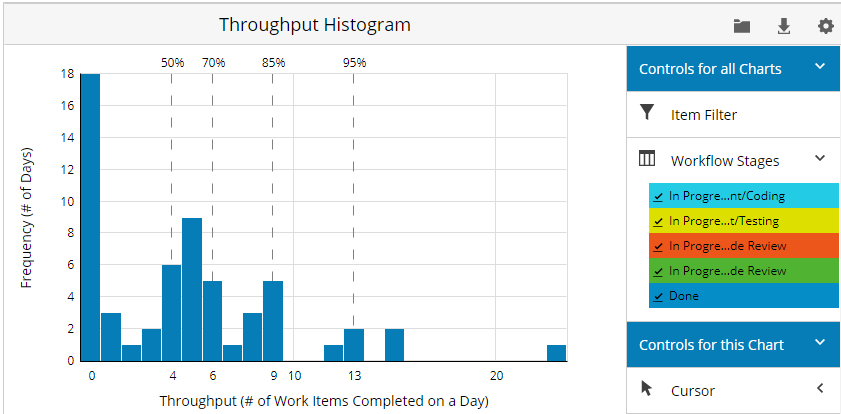
(2) Track your Throughput metric using a standard Throughput Histogram or use the Run Chart if you prefer data values displayed like this.
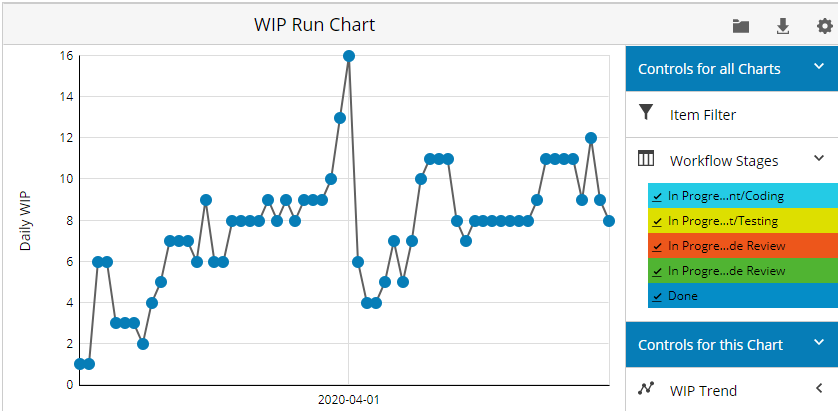
(3) Control your Work in Progress (WIP) via Aging WIP chart or find trends and patterns using the Run Chart visualization.
(4) Check the stability of your flow and measure flow efficiency using, respectively the Cumulative Flow Diagram and the Flow Efficiency chart.

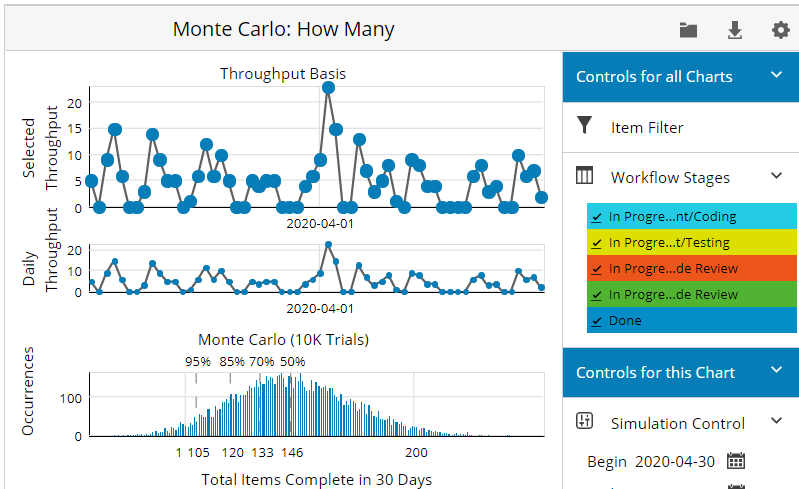
(5) Use the two Monte Carlo simulations ("How many" and "When") to anticipate how many tasks your team can finish during a predetermined time frame or when a certain number of tasks might be completed.
2. New Widgets based on the Analytics
To further boost the Analytics functionality, we have added 11 new widgets that correspond to each chart. You can pin selected widgets directly on your Dashboard, so you don't have to navigate to different screens to track your most important metrics. Each widget has its own configuration panel, which allows you to select the workflows that will be monitored. Moreover, users can set up their widgets to simultaneously track metrics of workflows that belong to different boards.
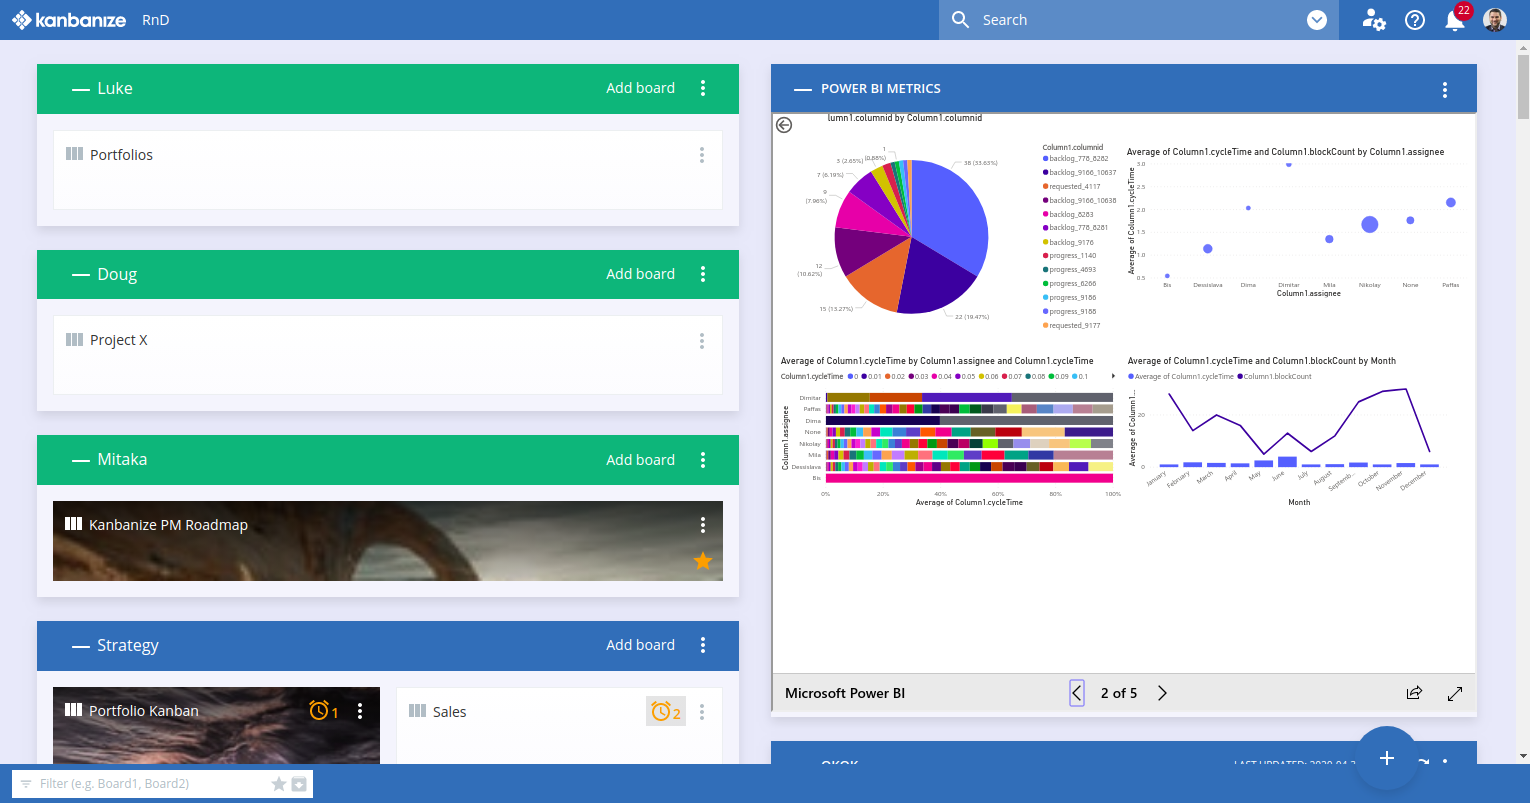
3. Kanbanize integration with Power BI
Take advantage of the two-way Kanbanize integration with Power BI and bring your complex data to life with interactive dashboards and engaging reports that you can collaborate, publish, and share.
To get started, download the free Microsoft Power BI Desktop application.
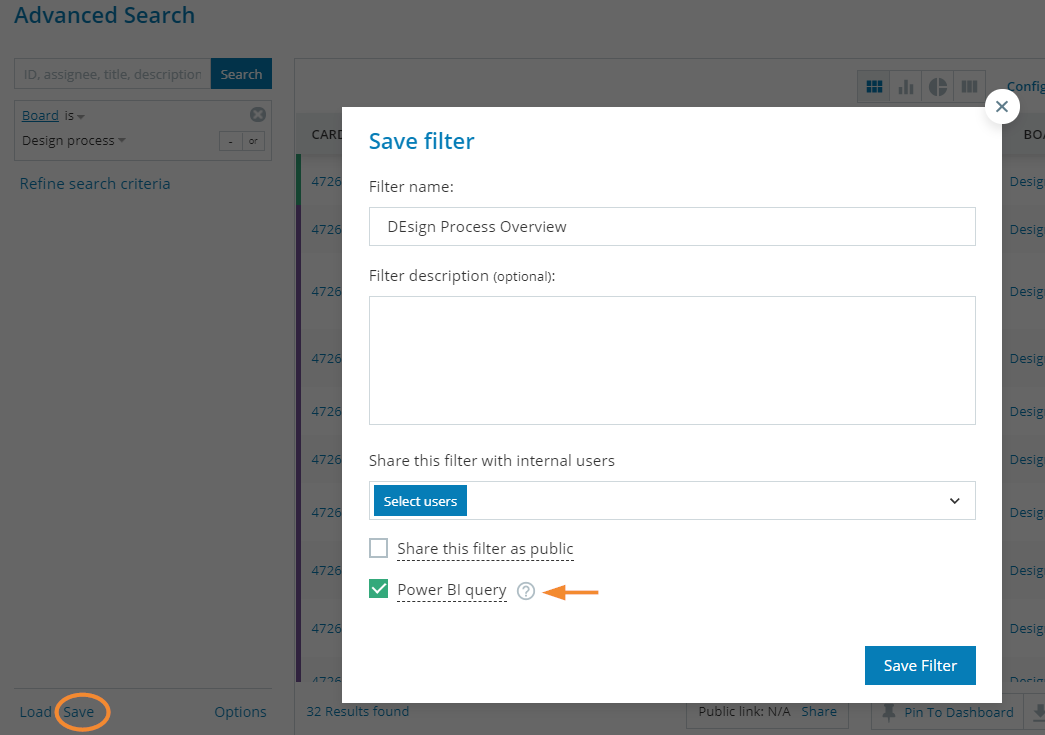
Use the Advanced Search functionality in Kanbanize to run custom reports and save the filters you created. Get the BI query and use the script in the advanced query editor inside Power BI to build compelling visualizations with dynamic data.
The two-way integration allows you to embed the Power BI reports directly on your Kanbanize dashboard. You can achieve this using the new "Power BI Reports" widget in Kanbanize. Just get your embed link from the "Embed" or "Publish to Web" functions in Power BI Service and save the widget. It remains synchronized with the source report in Power BI. Don't forget to set up your " Scheduled Refresh" settings in Power BI. To learn more about this topic, please check the dedicated article.
4. Improved Card Tags management
In our continuous efforts to improve the card management in Kanbanize, we are introducing several changes in that direction.
- Centralized Card Tags creation
This product update brings improvements in Card Tags management which allow you to apply custom naming convention of tags across boards.
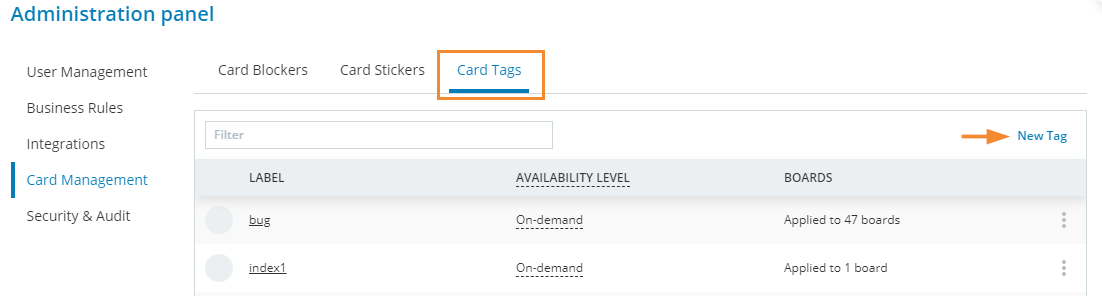
Previously, creating tags was done from the UI in the card itself. In this way, the creation of tags was not centralized and this posed a risk for adding tag duplicates. With the new update, the functionality of creating tags is performed from a dedicated screen in the Administration panel.
All existing tags get stored under the "Card Tags" tab. To learn more about the tag creation process, please check the dedicated article.
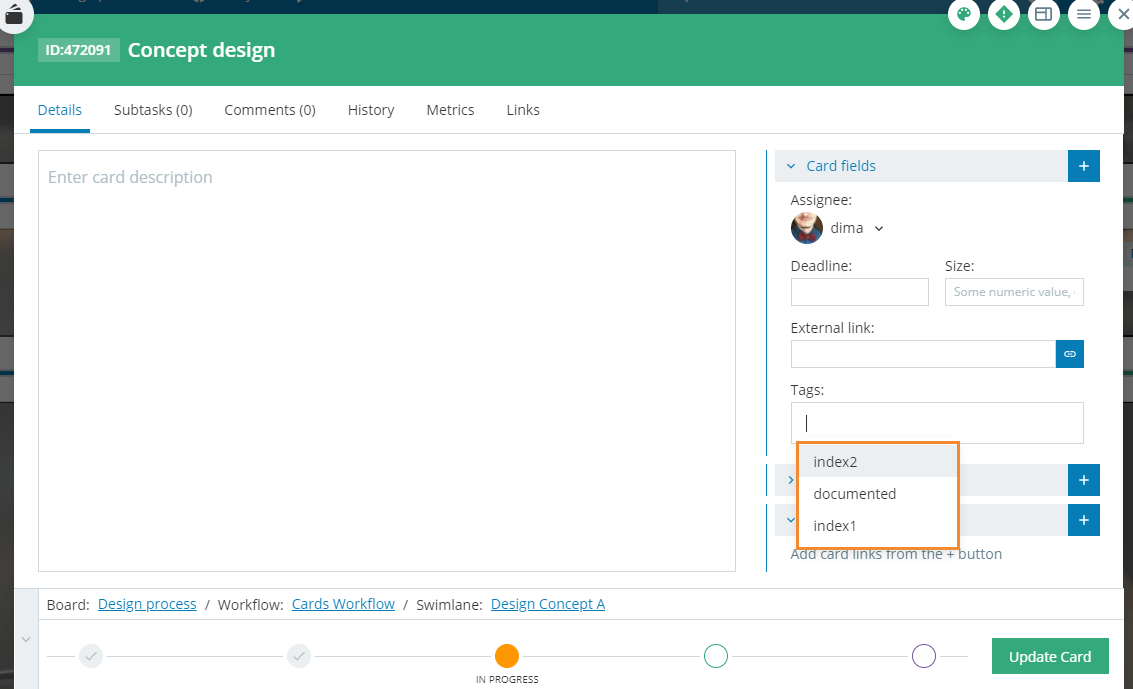
Now, when you add a tag to a card, you select it from a dropdown list and minimize human errors.
TIP: Users with the respective permissions can create tags when they input a value in the card Tag field and press Enter. This will automatically create the tag. It will get stored in the respective panels for further reuse.
Note: For users' convenience, Card Tags can be accessed and managed on a Board level from the Board sidebar panel (the three dots icon). - Dedicated Card Controls section in Security Controls
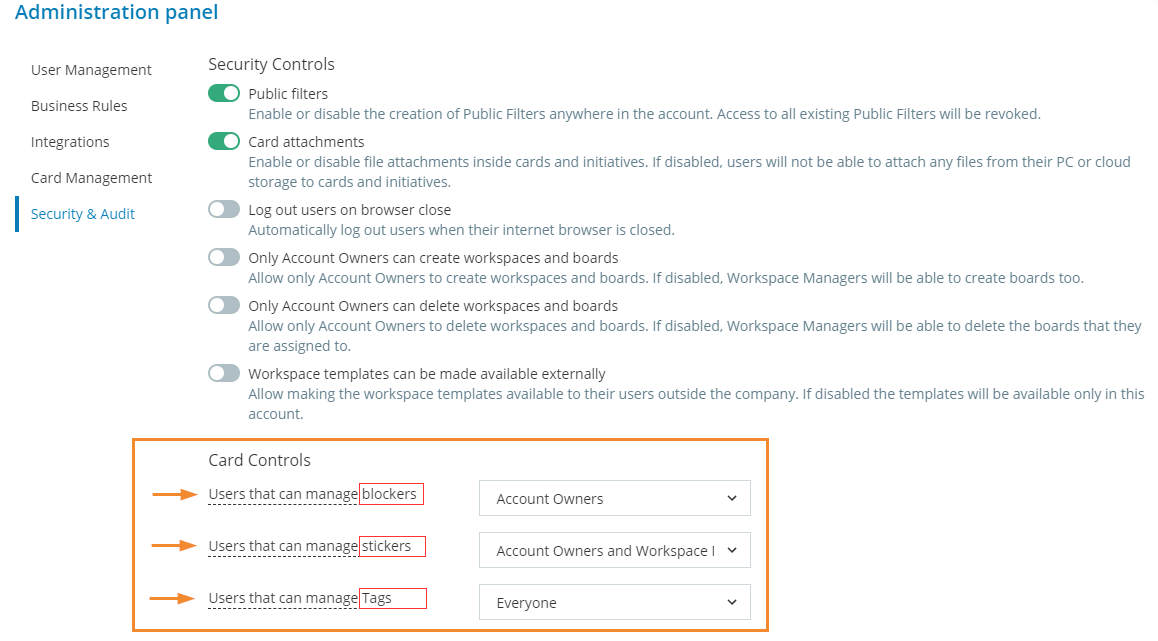
To improve the global account management of blockers, stickers and tags (new), we separated the "Card Controls" section under Security Controls.
With this Release, card tags become manageable at a global account level just like blockers and stickers. In general, the card control options define who in the account will be able to create, edit, and delete blockers/stickers and tags. Previously, only Account Owners and Workspace Managers were entitled to do these actions. The new option "everyone" that has been added allows any user role to manage those card properties.
5. New Advanced search criteria
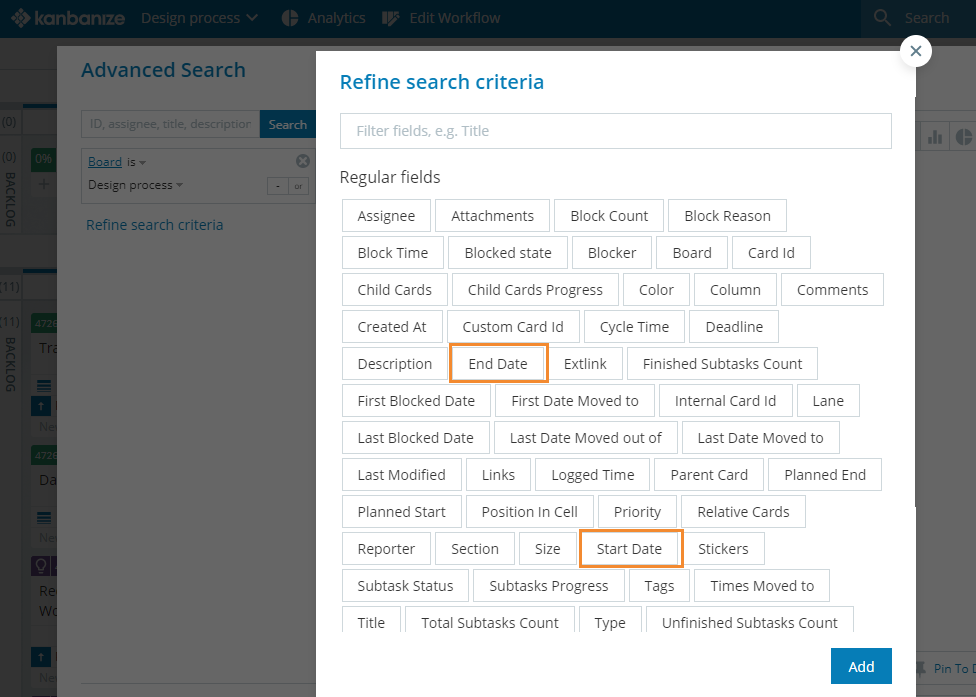
When implementing and tracking projects, it is important to know the actual start and end date of your tasks. With this release, we made changes to the "Actual Start" and "Actual End" pills in the Advanced Search panel that were previously available for Timeline Initiatives only.
They are now named, respectively, "Start Date" and "End Date" and can be applied to both cards and Initiatives.
- Start date - shows the first date when an item goes to "In progress".
- End Date- shows the last date when an item goes to "Done".
6. More Initiative Warnings
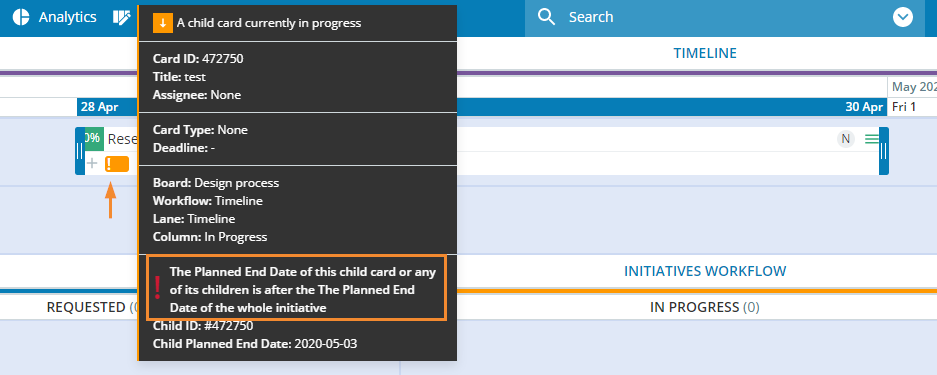
We have been continuing to improve the Initiatives' visualization when inconsistencies in the breakdown structure occur. This time the focus is on the Timeline Initiatives and the new warning sign related to the Planned End date property.
When Timeline Initiatives are in a hierarchical structure, the system will persistently display an exclamation mark if it happens that the Planned End Date of the parent Initiative is before the Planned End Date of any of the child items in the existing structure.
Note: The system also signals for any disagreements in terms of Deadline and Size entries.
7. Other Product Improvements
We continuously work to improve the user experience with the platform. The recent update includes the following changes:
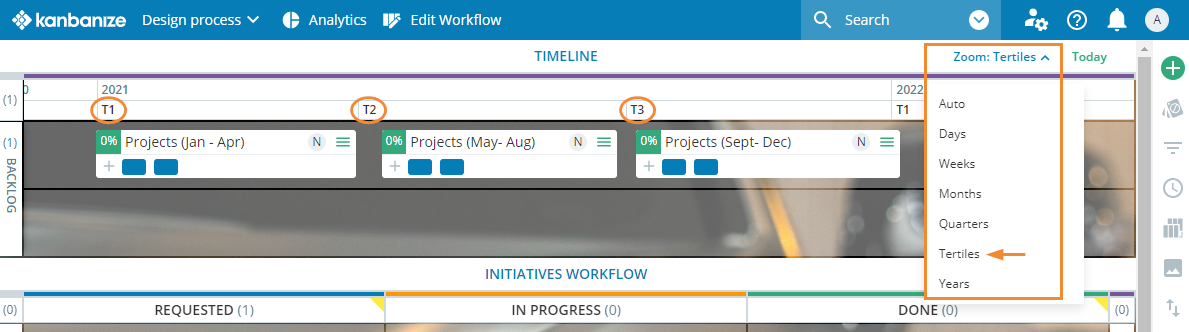
- Timeline Tertiles view
The Timeline view can be set to display the time as in Days, Weeks, Months, Quarters, and Years. With this release, we have added the Tertile (a third of a year) selection in the Timeline view.
It breaks up the calendar year into three parts as many organizations prefer to get the year divided into four-month sections.
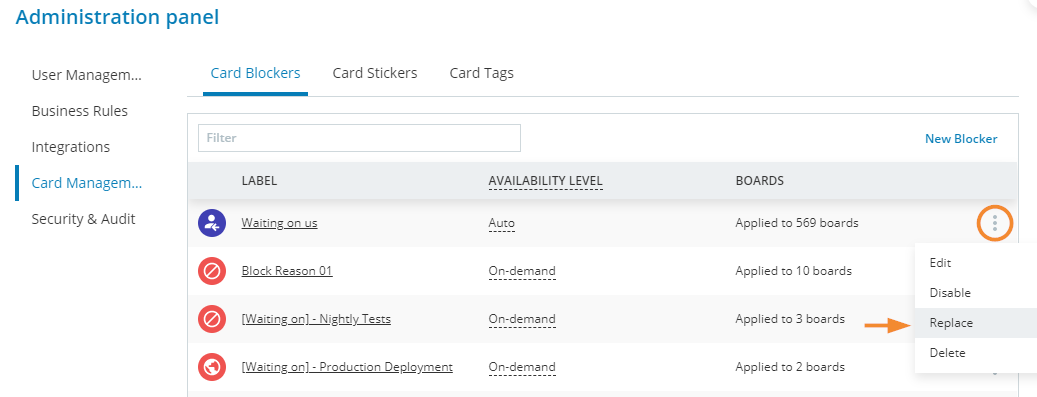
- Replace functionality for blockers and stickers
To make blocked reasons explicit and to categorize tasks, we use tokens (blockers and stickers). Sometimes, a token you have created is not of use anymore or there are two similar tokens.
To keep your account environment clear, you have to maintain it accordingly. The easiest way would be to delete the token, but then it will disappear from all cards marked with it.
With the new functionality, you will be able to "replace" an unneeded token with an existing one. The redundant token will be deleted and all cards will obtain the replacement.
Users perform this action from the "Card Management" section in the Administration panel.
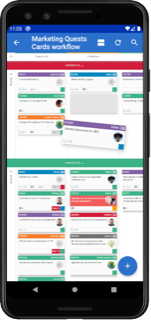
8. Mobile Apps (Android improvement)
We are excited to present to you the news on the mobile front this update.
With the new release of our Android app, we present a new board view.
For your convenience, you can now move cards using the drag & drop functionality on the new whole board view.